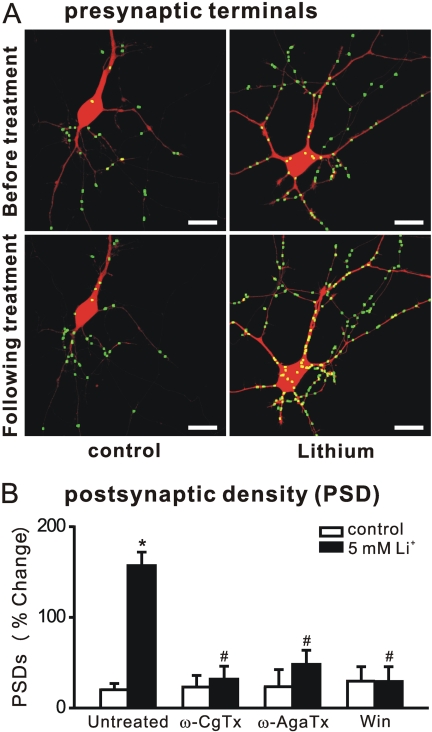
Fig. 6.
Presynaptic regulation of lithium-induced synapse formation. A, processed images acquired before and after 4-h treatment with 5 mM lithium display fluorescent puncta formed from the expression of synaptophysin fused to GFP superimposed on DsRed2 fluorescence. Scale bar, 10 μm. Note that many hippocampal neurons in culture form autapses. B, relative change in the number of PSDs (average percentage change from initial counts) after 4-h treatment in the presence of the presynaptic Ca2+-channel blockers 1 μM ω-conotoxin GVIA (ω-CgTx) and 1 μM ω-agatoxin IVA (ω-AgaTx) or the cannabinoid receptor agonist 100 nM Win 55,212-2 (Win). Data are presented as mean ± S.E.M. *, p < 0.01 compared with untreated control; #, p < 0.01 compared with lithium-induced response in the absence of drug (untreated), ANOVA with Bonferroni post test.

