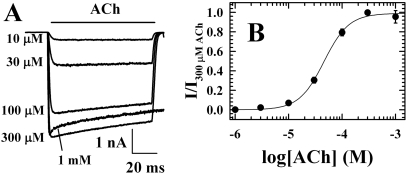
Fig. 1.
Responses to ACh measured by rapid perfusion of T. californica nAChRs in detached patches. A, representative macroscopic current responses when an “outside-out” patch at a holding potential of -50 mV was exposed to varying concentrations of ACh for 100 ms. Each trace is the average of four sweeps, with 20 s between each sweep. B, the concentration dependence of the peak ACh responses, with data from two patches normalized to the response to 300 μM ACh and error bars indicating the range. The response was fit by Kapp = 43 ± 4 μM and nH = 1.9 ± 0.2.

