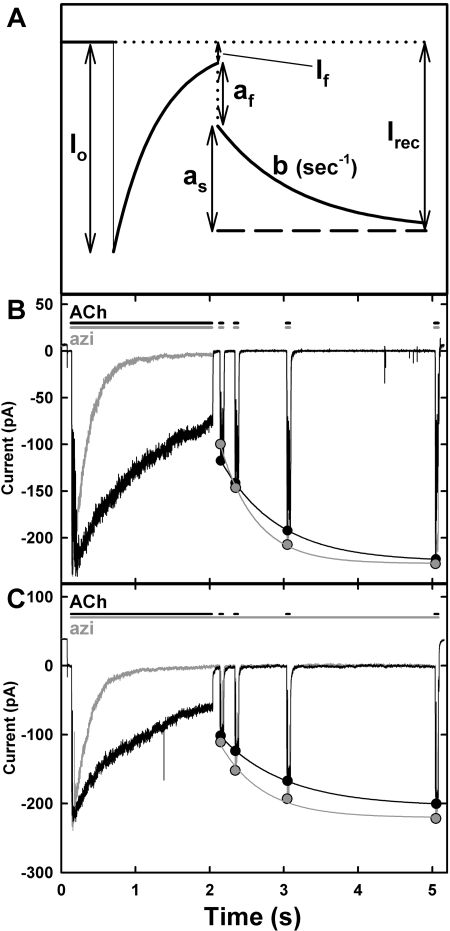
Fig. 3.
Recovery of ACh responses after inhibition by azietomidate. A, a schematic defining the parameters characterizing the kinetics of recovery of ACh responses after exposure to ACh in the absence or presence of azietomidate. After exposure to a stream of ACh ± azietomidate, the patch was switched to a stream that contains buffer, with ACh sensitivity monitored by moving the patch for 50 ms into 300 μM ACh + azietomidate after 0.1, 0.3, 1.0, and 3.0 s of recovery. I0 is the peak initial response to 300 μM ACh ± 10 μM azietomidate; If is the current after 1.95 s. The observed recovery was fit to a single exponential: I = Irec - as exp-bt, where Irec is the current after full recovery, as is the amplitude of the observed slow recovery on the time scale of seconds, and b is the rate constant The amplitude of the rapid phase of recovery, af, is equal to Irec - (as + If). B and C, experimental traces from two patches. The black traces are the ACh controls (1.95-s exposure to 300 μM ACh, followed by recovery in buffer with test pulses of 300 μM ACh), and the gray traces are the currents seen during exposure to ACh + 10 μM azietomidate, followed by recovery in buffer alone (B) or in a stream containing 10 μM azietomidate (C), with recovery tested by exposure to 300 μM ACh and 10 μM azietomidate. Traces shown in B and C are the average of four to six sweeps, each with 20 to 30 s between each sweep. The parameters characterizing the recovery kinetics are detailed in Table 1.

