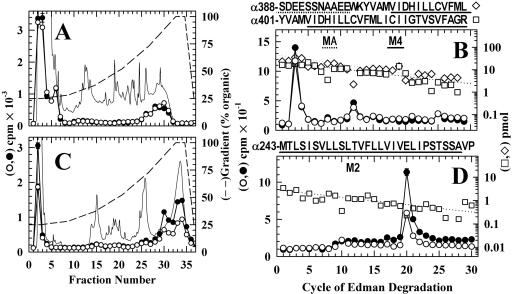
Fig. 5.
Photolabeling in the nAChR α subunit transmembrane domain after 50-ms exposure to agonist and [3H]azietomidate. nAChR-rich membranes (12 mg/condition) equilibrated without (Open, filled symbols) or with (Des, open symbols) 10 mM Carb were exposed to 10 μM [3H]azietomidate + 10 mM Carb for 50 ms before freezing and photolabeling. After photolabeling, V8 protease digests of the α subunits were fractionated by SDS-PAGE and visualized by Coomassie blue stain, and material was eluted from the 10 kDa (αV8-10) and 20 kDa bands (αV8-20). The left panels are reversed-phase HPLC fractionations of (A) trypsin digests of αV8-10 samples (11,000 cpm injected each condition; recovery >90%) and (C) EndoLys-C digests of αV8-20 (•, 17,300 cpm injected; ○, 9600 cpm injected; 70% recoveries). Also included are the absorbance at 215 nm (dotted line) and the HPLC gradient (% organic). The right panels are 3H (•, ○) and PTH-amino acids (⋄, □) released during sequence analysis of nAChR subunit fragments beginning near the amino terminus of αM4 (pools of HPLC fractions 26-31 from A) (B), and αM2 (pools of HPLC fractions 29-31 from C) (D). The primary amino acid sequences are shown above each panel. B, each sample contained α subunit fragments beginning at αTyr-401 (Des, □, I0 = 23 pmol; Open, I0 = 16 pmol, not shown) and at αSer-388 (Des, ⋄, I0 = 46 pmol; Open, I0 = 28 pmol, not shown). The major peak of 3H release in cycle 3 indicated labeling of αGlu-390, and the minor peaks of 3H release in cycles 12 and 25 indicated labeling of αCys-412 within the fragments beginning at αTyr-401 and αSer-388, respectively. D, each sample contained as the primary sequence the fragment beginning at αMet-243 at the N terminus of αM2 [Open and Des (□), I0 = 2.9 pmol]. The peak of 3H release in cycle 20 indicated labeling of αGlu-262. The pool of HPLC fractions 32 to 35 from C contained fragments beginning at αSer-173 (9 pmol, each condition) and at αMet-243 (7 pmol, each condition) and a single peak of 3H release in cycle 20.

