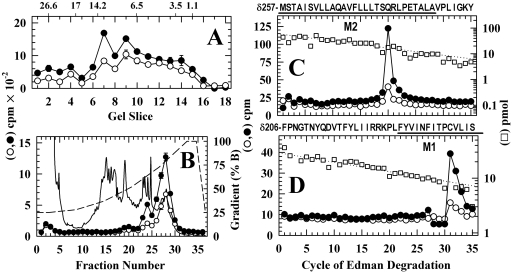
Fig. 6.
Photolabeling in the nAChR δ subunit transmembrane domain after 50-ms exposure to agonist and [3H]azietomidate. nAChR δ subunits isolated from the labeling described in Fig. 5 were digested with EndoLys-C and fractionated by Tricine SDS-PAGE. A, the distribution of 3H eluted from 5-mm bands of the gel (Open, •, 26,800 cpm loaded, 14,600 recovered; Des, ○, 17,400 cpm loaded, 10,200 cpm recovered). The mobilities of the molecular mass markers are indicated above the graph. B, reversed-phase HPLC fractionation of material eluted from gel bands 7-9 (•, 6350 cpm injected, 6000 recovered; ○, 4060 cpm injected, 3330 cpm recovered). Also included are the absorbance at 215 nm for the Des sample (solid line) and the HPLC gradient in percent organic phase (dashed line). The right panels are the 3H (•, ○) and PTH-amino acids (□) released during sequence analysis of nAChR subunit fragments beginning at the amino terminus of δM2 (pools of HPLC fractions 26-29) (C) and M1 (pools of HPLC fractions 22-24) (D). C, the primary sequence began at δMet-257 at the N terminus of δM2 (Op, I0 = 61 pmol, not shown; Des, □, I0 = 60 pmol) and secondary sequences began at δAsn-437 (Open, 21 pmol; Des, 20 pmol) and δPhe-206 (Open, 3.7 pmol; Des, 2.8 pmol). The peak of 3H release in cycle 20 was consistent with labeling at δGln-276 from the primary sequence detected. D, the primary sequence began at δPhe-206 before δM1 (Open, I0 = 30 pmol, not shown; Des, □, I0 = 29 pmol). The peak of 3H release in cycle 31 indicated labeling of δCys-236.

