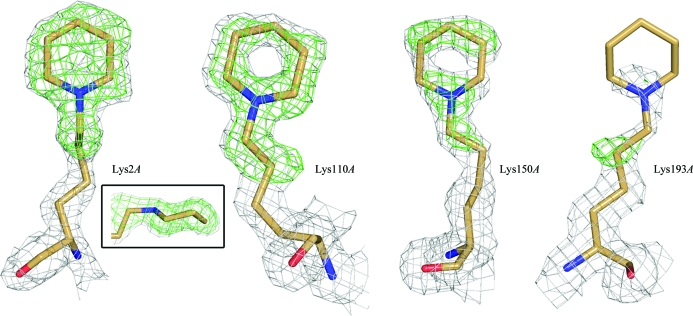
Figure 4.
Electron density for the typical (Lys193A) and best ordered (Lys2A, Lys110A, Lys150A) lysine residues of EfsQnr. The final 2F o − F c electron density contoured at 1σ is shown in gray. The OMIT F o − F c electron density contoured at 2.5σ is shown in green. The boxed figure shows the electron density of Lys2A looking parallel to the piperidine ring. See §2 for the OMIT procedure.

