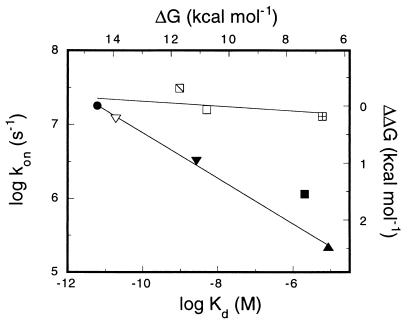
Figure 3.
Brønsted plot comparing the logarithm of the association rate constant (kon) to the logarithm of the dissociation constant (Kd) for S-peptide analogues binding to native S-protein under the conditions described in Fig. 1a. The symbols are defined in Fig. 2, and the data are fitted by straight lines.

