
Figure 6. Intrahepatic bile duct and canalicular defects in zebrafish injected with an ASO directed against zebrafish miRNA 30a.
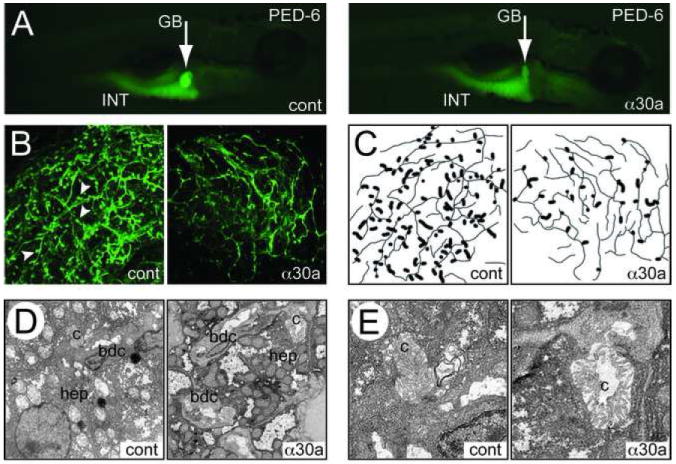
(A) PED6 uptake in 5 dpf larvae injected with an control oligonucleotide (cont) or with an ASO against miR-30a (α30a) GB, gall bladder; INT, intestine. (B) Cytokeratin immunostaining on control and α30a-injected 5 dpf larvae (Magnification 600x). (C) Schematic representation of (B) reveals a decrease in the number of terminal ductules (arrowheads) in the ASO-injected fish, indicated in the schematic as the wider lines. (D) Low-power (2500x) electron micrographs of control and α30a ASO-injected 5 dpf larvae showing bile duct cells (bdc) and hepatocytes (hep). Note the relatively similar overall appearance. (E) Higher-power (10000x) views showing a representative canaliculus (c), which is dilated and abnormal-appearing in the α30a ASO-injected larva.