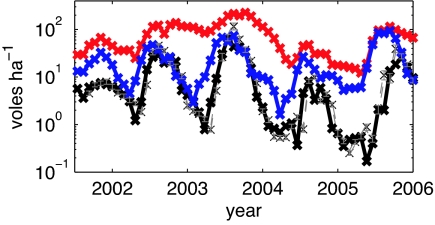
Fig. 1.
Time series data of cowpox infection status in one natural population of field voles. We show total population size [N(t), red] and the population sizes of susceptible [S(t), blue] and infected [I(t), black] individuals; for brevity, we have omitted the data on recovered individuals. We overlay the mean and 95% credibility intervals of estimated I(t) for our best-fit model (Eq. 5) by using the mean best-fit parameters (q = 0.62, β = 0.18, M = 7.1, Δ = 0.69, A = 0.67, gray). The qualitative patterns are very similar for all four populations studied (see SI Text, Fig. S1).

