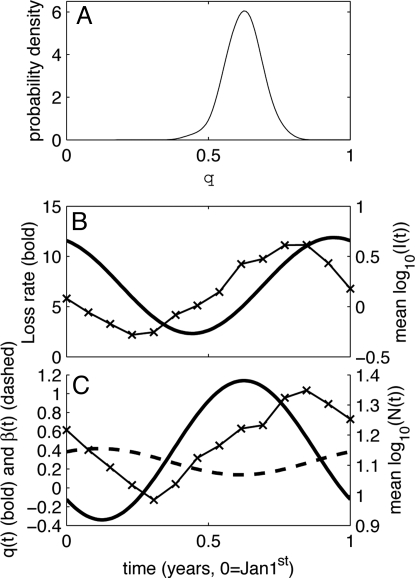
Fig. 3.
Parameter estimation results for the best-fit model of cowpox infection in field vole populations (Eq. 5). (A) Probability density function for estimated q (see Methods). See Fig. S2 for probability distributions of the other parameters. (B) Example realization of the best-fit seasonal loss rate (M = 7.1, Δ = 0.69, A = 0.67), with the time series data of infected population density overlaid [taking mean of log10(I(t)) of the four sites and for the four complete years of time series data]. (C) Example results of making the parameters q and β functions of time when fitting Eq. 5 to the data, alongside the mean annual variation in log10(total vole density), averaged across all sites.

