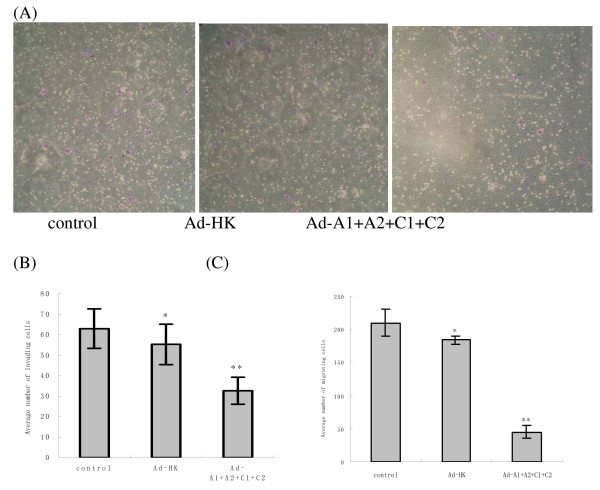
Figure 6.

indicates that silencing of RhoA and RhoC may inhibit the invasion and migration of HCT116 cells. The number of invading cells was determined by counting the cells stained with 0.01% crystal violet solution in the lower side of the membrane (A). The graphs (B, C) compare the numbers of transmembrane cells in invasion and migration experiments. Data represent the mean value ± SEM of three independent experiments. *P > 0.05, no significantly difference between the cells treated with Ad-HK and the control cells. **P < 0.05, compared with other groups.
