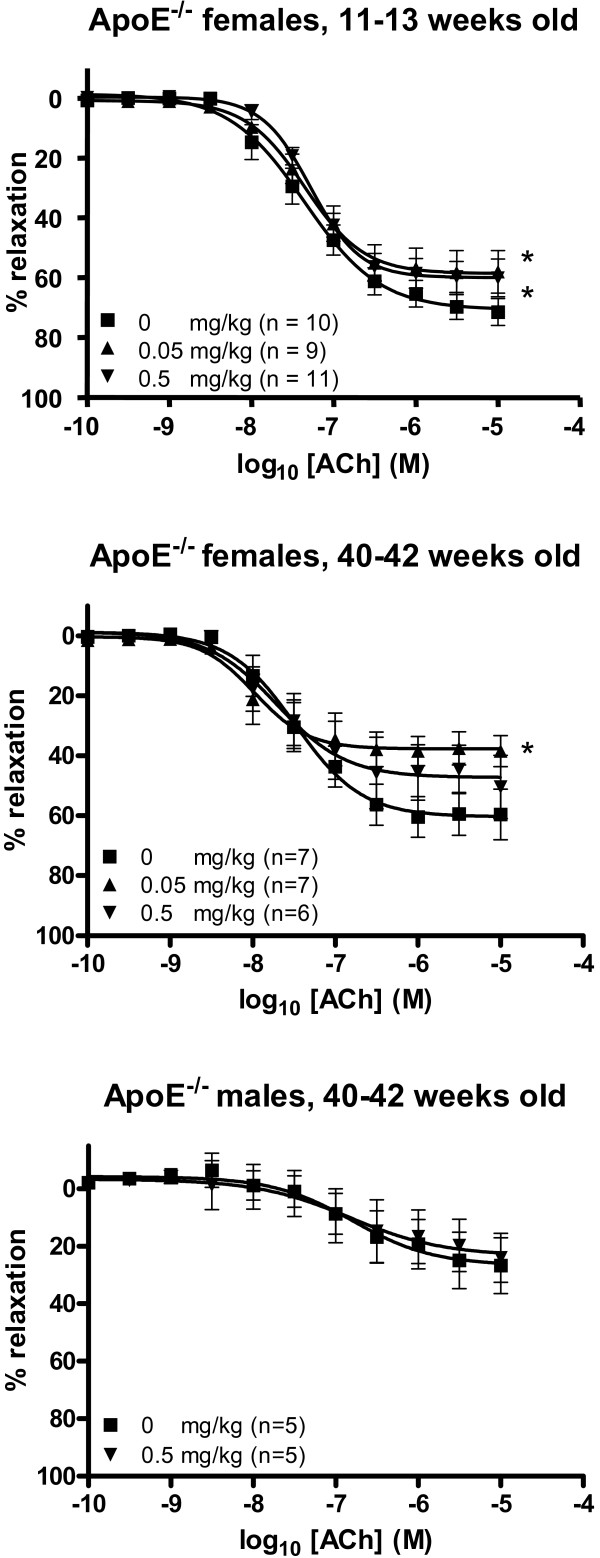
Figure 3.
Endothelium-dependent vasorelaxation of aorta segments from apoE-/- mice treated with C60 fullerenes by i.p. injection. The response is expressed as the percent relaxation of the precontraction tension produced by prostaglandin 2α. Each point on the curves represents the cumulative response at each concentration of acetylcholine (ACh). The data are expressed as the mean and SEM. * denotes a significant effect on Emax compared to the control group (P < 0.05, ANOVA with unequal vaiance between groups).

