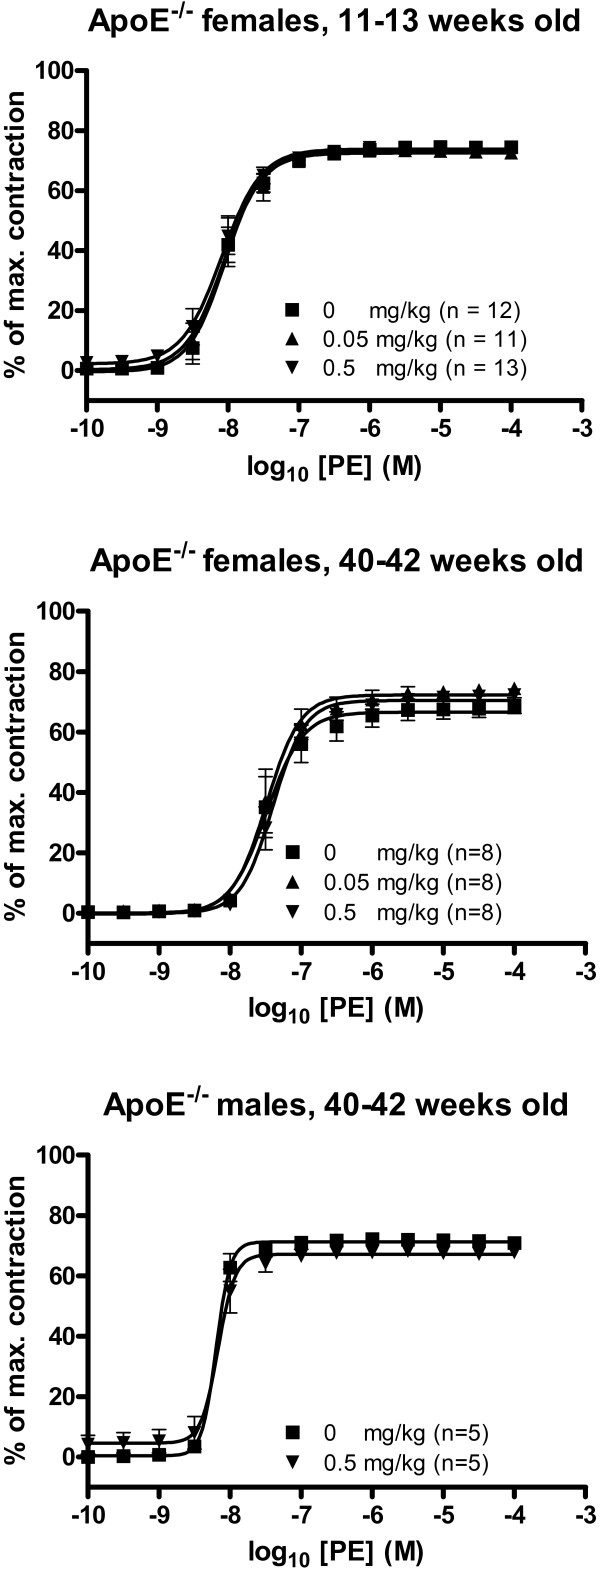
Figure 5.
Receptor-dependent vasoconstriction of aorta segments from apoE-/- mice treated with C60 fullerenes by i.p. injection. The response is expressed as the percent of the maximal contraction induced by stimulation with a cocktail of K+-PSS, PGF2α and U-46619. Each point on the curve represents the cumulative response at each concentration of phenylephrine (PE). The data are expressed as the mean and SEM. * denotes a significant effect on Emax compared to the control group (P < 0.05, ANOVA with unequal variance between groups).

