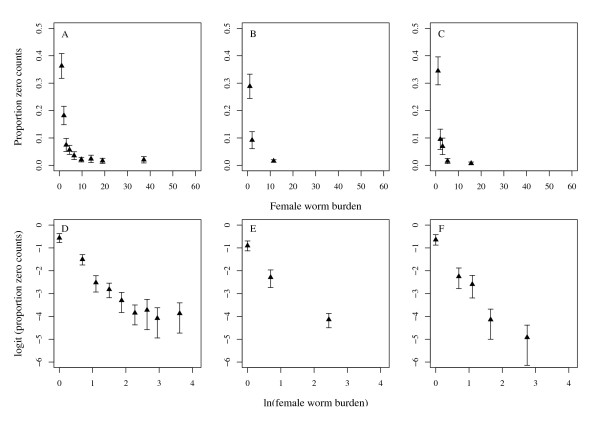
Figure 3.
Relationship between the proportion of zero egg counts and female worm burden. Top row: a scatter plot of the proportion of zero egg counts per stratum of female Ascaris worm burden in the baseline (A), 1st (B) and 2nd (C) re-infection populations. Bottom row: logit of the proportion of zero egg counts per stratum of the natural logarithm of female worm burden in the baseline (D), 1st (E) and 2nd (F) re-infection populations showing approximately linear relationships.

