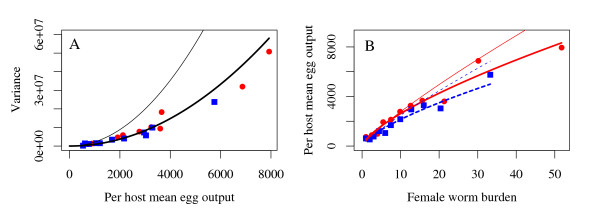
Figure 6.
Comparison of the fit of a log-normal and zero-truncated negative binomial model. A: The estimated variance-to-mean relationship from the zero-truncated negative binomial model (black thick line) and the log-normal model (black thin line). B: The fitted zero-truncated (thick lines) and log-normal (thin lines) models to data from children (red solid line) and teenagers and adults (blue broken line) in the baseline population. In both figures red circles represent grouped mean data from children and blue squares from teenagers and adults (as defined in Figure 5). Details of the variance-to-mean relationship for the log-normal and zero-truncated negative binomial models are given in additional file 1.

