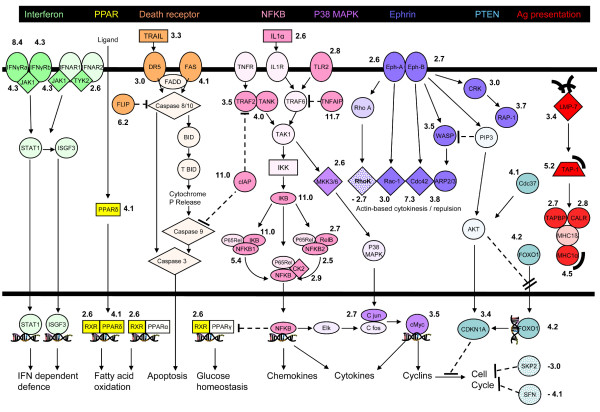
Figure 2.
Regulated molecules in canonical signalling pathways identified by IPA. Individual pathways are identified by colours assigned in the black-backed heading at the top. Significantly up-regulated genes are shown in darker colour. Significantly down-regulated genes are shown stippled. Numerical values beside regulated genes show the S score. All genes identified by the IPA programme as significantly regulated have been included, together with a limited number of non-regulated genes to portray a simplified view of pathway continuity. For simplicity, molecules participating in more than one pathway are arbitrarily shown once in the most dominant pathway. Common transcriptional and other consequences of pathway activation are indicated in the Figure. Symbols are as in Figure See Figure 3 except that ---l = Inhibition (direct or indirect), ---ll = blocks translocation,) = Peptide, double helix = transcription.

