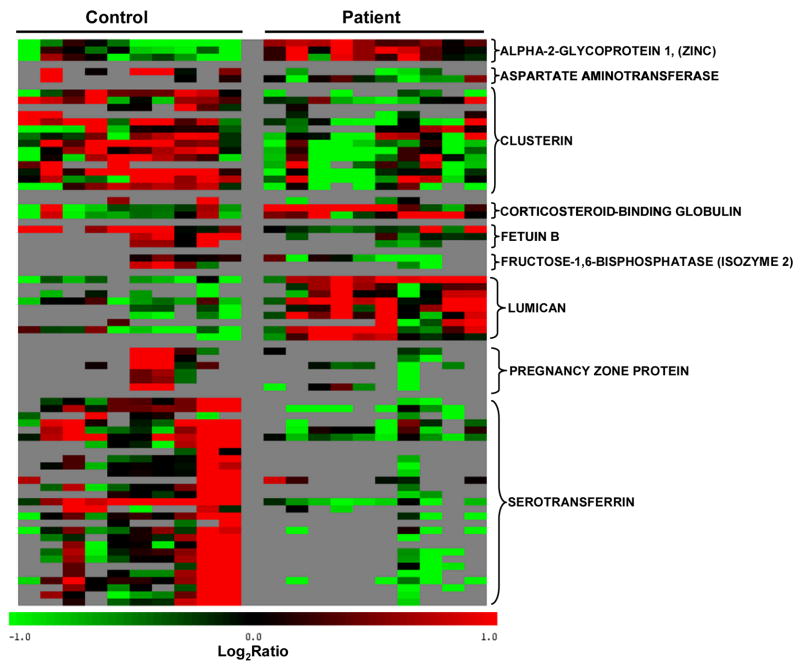
Figure 6.
Heat map of relative protein abundances displayed as their constituent relative peptide abundances. Peptide relative abundances in log2 ratio format were mean-centered, and protein level relative abundances were estimated as the median of peptide relative abundances for all peptides originating from a given protein. Only those proteins passing a t-test on both the protein (p<0.05) and peptide (p<0.1) levels are shown. Each row represents a unique peptide.

