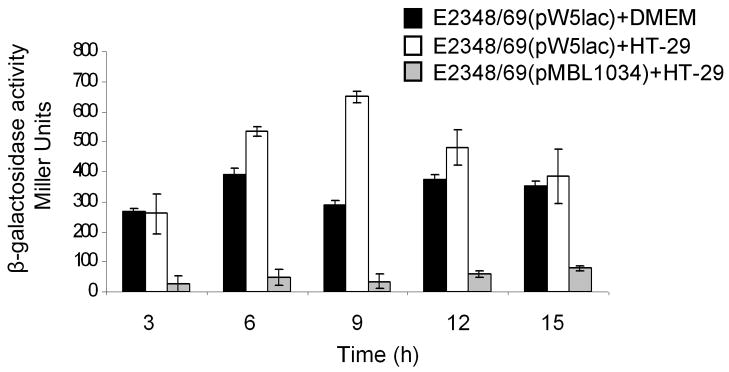
Fig. 4.
Transcriptional activation of csgD. A csgD::lacZ transcriptional fusion was tested for activity in E2348/69 grown in DMEM (black bars) and in the presence of HT-29 cells (white bars) from 0 through 15 h. The negative control (gray bars) is E2348/69 with pMLB1034 vector lacking csgD. The experiments were performed three times in triplicate on separate days and the results represent the mean of the averages obtained from those three experiments with standard deviations bars.

