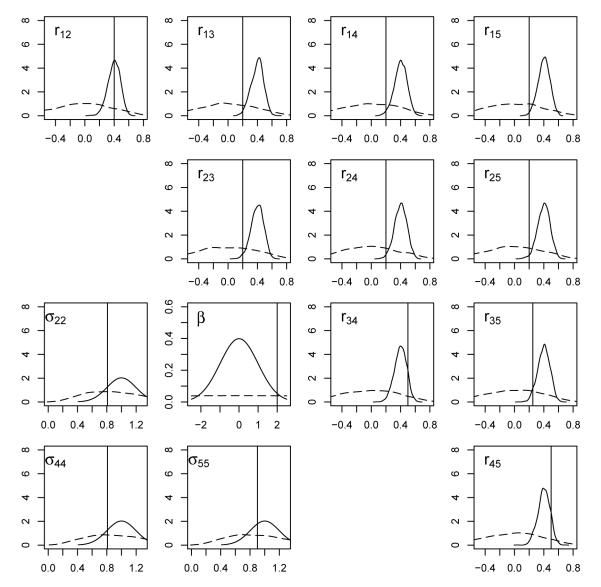
Figure 1.
Prior density plots for the regression parameter (β), variance parameters (σ22, σ44, σ55), and correlations (rij). The dotted lines are for the PXW_ID_Weak scenario, the solid lines are for the PXW_CS_Strong scenario, and vertical lines have been drawn at the true value for each parameter.

