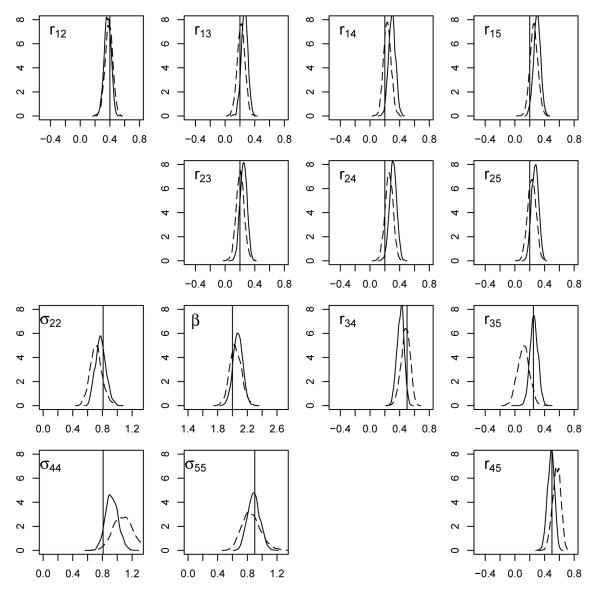
Figure 2.
Posterior density plots for the regression parameter (β), variance parameters (σ22, σ44, σ55), and correlations (rij). Dotted lines correspond to the PXW_ID_Weak scenario, and solid lines correspond to the PXW_CS_Strong scenario. Vertical lines have been drawn at the true values for each parameter. The plots show some sensitivity to prior specification for variance parameters, somewhat less sensitivity in correlation parameters (with r35 a possible exception), and little sensitivity for the regression parameter.

