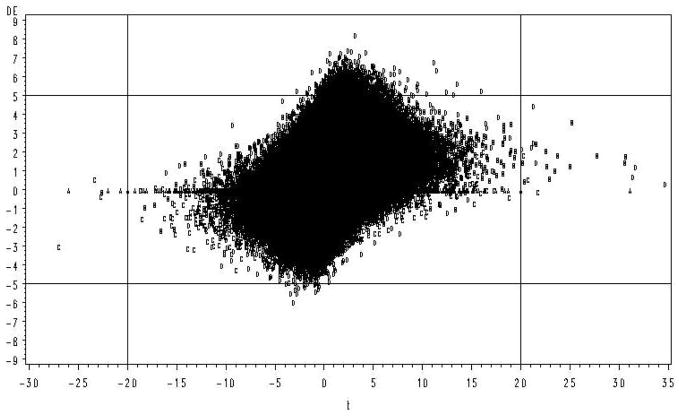
Figure 1.
Simulation results for two treatments, each with 4 replicates. Treatment effects and random errors were sampled from a normal distribution. True DE plotted against the calculated value of t. Observations associated with each of the 4 distributions are identified by letter (A=D(0), B=D(1), C=D(1′), D=D(2))

