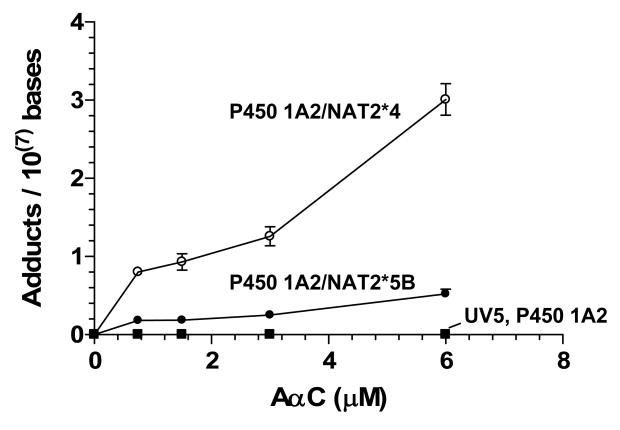
Figure 5.
AαC-DNA adduct formation UV5/P450 1A2/NAT2*4 (○), UV5/P450 1A2/NAT2*5B (●), UV5/P450 1A2 (■), and untransfected UV5 (□) cell lines. Each data point represents the mean ± S.E.M. from three independent analyses. Linear regression analysis revealed that the slope of the curve (adduct formation/AαC concentration) was significantly higher for the UV5/P450 1A2/NAT2*4 cell line than for the UV5/P450 1A2/NAT2*5B cell line (p<0.0001).

