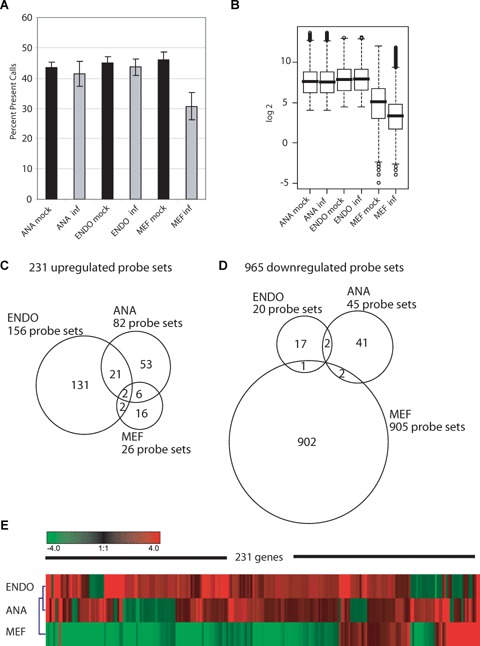
Fig 1.

Overview of the general changes in expression values upon murine gammaherpesvirus 68 (MHV-68) infection. (A) Barplot showing the mean percentage of Affymetrix present calls for the three arrays of one condition, respectively. The present call is an indication for the reliability of detection of a probe set. Standard deviation is shown based on three array replicates. (B) Boxplots representing the normalized log2 expression values of all 12,488 transcripts present on the arrays, averaged per condition, for the three BL/6-derived cells, mock and MHV-68 infected, respectively. (C) Venn diagram describing the partitioning and overlap of the 231 significantly up-regulated probe sets among the three cellular systems. (D) Diagram as in C for the 965 significantly down-regulated probe sets. (E) Hierarchical Clustering of the average fold-changes induced by the viral infection. The 231 transcripts clustered are significantly different in at least one cell type with a fold-change >2 compared to the respective mock-treated cells. Red colour indicates up-regulation, green colour down-regulation after virus infection. ANA, Ana-1 macrophages; ENDO, embryonic endothelial progenitor cells or eEPCs; MEF, primary mouse embryonic fibrob-lasts; all cell types are of BL/6 genetic background.
