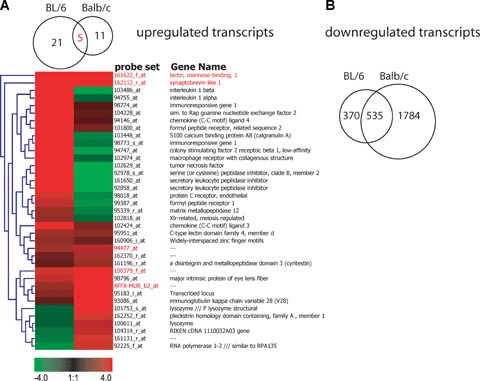
Fig 2.

Common and unique changes in gene expression comparing BL/6 and Balb/c-derived MEF cells. (A) Venn diagram and heat map showing the 36 transcripts that are significantly up-regulated in either BL/6 or Balb/c MEF cells. The heat map is based on fold-changes. Red colour indicates up-regulation, green colour down-regulation after MHV-68 infection. (B) Venn diagram of the 2698 transcripts that are significantly down-regulated in MEF cells.
