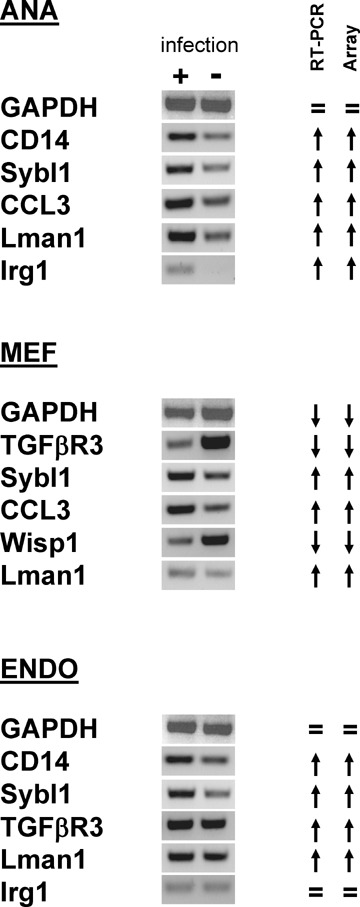
Fig 3.

Validation of microarray data by RT-PCR. Total RNA derived from infected or non-infected cells was reverse-transcribed, and the resulting cDNA was amplified using gene-specific primers. RT-PCR products were separated by electrophoresis in 2% agarose gels and visualized by ethidium bromide staining. Upward- and downward-pointing arrows indicate up- and down-regulation, whereas ‘=’ indicates that the expression was unchanged. In all cases, RT-PCRs were consistent with the microarray data. ANA, Ana-1 macrophages; ENDO, embryonic endothelial progenitor cells or eEPCs; MEF, primary mouse embryonic fibroblasts
