
Figure 3.
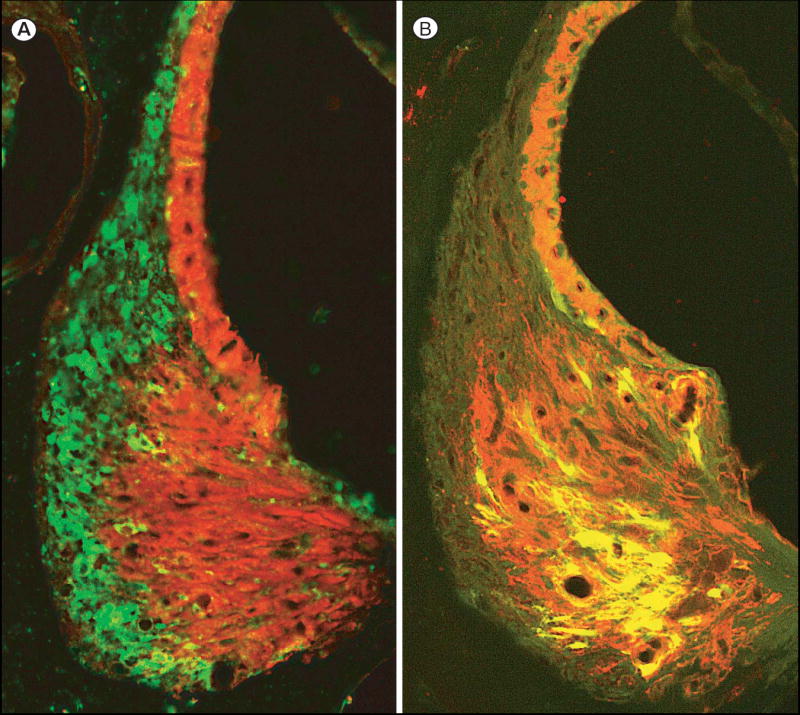
Fluorescent micrographs contrasting the localization of NF- B activation in type I and type II fibrocytes. A. Image of GFP fluorescent type I fibrocytes (green) of a noise exposed mouse merged with red type II fibrocytes and stria vascularis. The latter structures are immunopositive for Na+, K+,-ATPase. (See Fig. 1D for key.) B. Merged image of GFP fluorescent type II fibrocytes in a mouse injected with 50 μg LPS. The type II fibrocytes appear yellow because they are also positive for Na+, K+,-ATPase, which is red as in panel C.