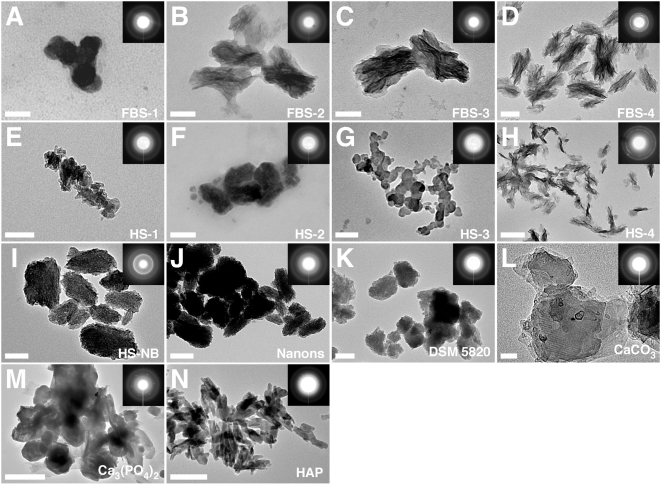
Figure 10. Serum granulations and NB specimens show similar electron diffraction patterns.
Serum granulations (pellets) obtained from untreated serum (A and E) or following addition of either CaCl2 (B and F), Na2HPO4 (C and G), or a combination of both (D and H) to the indicated serum, were processed for TEM without fixation or staining. NB cultured from 10% HS (I) as well as the NB strains “nanons” (J) and DSM 5820 (K) cultured in 10% FBS were also included for comparison. The electron diffraction patterns shown in the insets indicated that the serum granulations and the NB samples consisted of polycrystalline minerals either with a low degree of crystallinity as shown by the fuzzy rings (A, B, E–G) or with a more crystalline mineral phase as shown by the presence of arrays of dots on the corresponding diffraction patterns (C, D, H). In comparison, the commercial reagents CaCO3 (L), Ca3(PO4)2 (M), and HAP (N), used as controls, more consistently displayed a high degree of crystallinity as shown by the presence of dots on their electron diffraction patterns. Scale bars: 50 nm (A, L); 100 nm (B–E, G, I, J); 200 nm (F, H, K, N); 500 nm (M).

