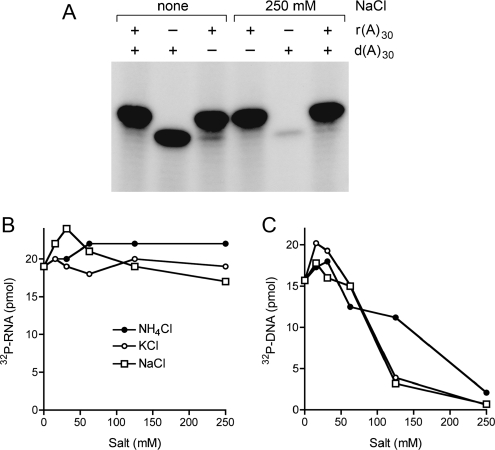
FIGURE 8.
Effect of monovalent salts. (A) Reaction mixtures (10 μL) containing 50 mM Tris-acetate (pH 6.5), 10 mM MgCl2, 500 μM [γ32P]ATP, 5 μM 5′-OH d(A)30 or r(A)30 as specified, 0.9 pmol PhoClp1, and either no added salt or 250 mM NaCl as indicated were incubated for 15 min at 55°C. The products were analyzed by denaturing PAGE and visualized by autoradiography. (B) Reaction mixtures (10 μL) containing 50 mM Tris-acetate (pH 6.5), 10 mM MgCl2, 500 μM [γ32P]ATP, 5 μM 5′-OH r(A)30, 0.4 pmol PhoClp1, and the indicated concentrations of NH4Cl, KCl, or NaCl were incubated at 55°C for 15 min. The extents of product formation are plotted as a function of salt concentration. (C) Reaction mixtures (10 μL) containing 50 mM Tris-HCl (pH 7.5), 10 mM MgCl2, 500 μM [γ32P]ATP, 5 μM 5′-OH d(A)30, 0.45 pmol PhoClp1, and and the indicated concentrations of NH4Cl, KCl, or NaCl were incubated at 55°C for 15 min. The extents of product formation are plotted as a function of salt concentration.

