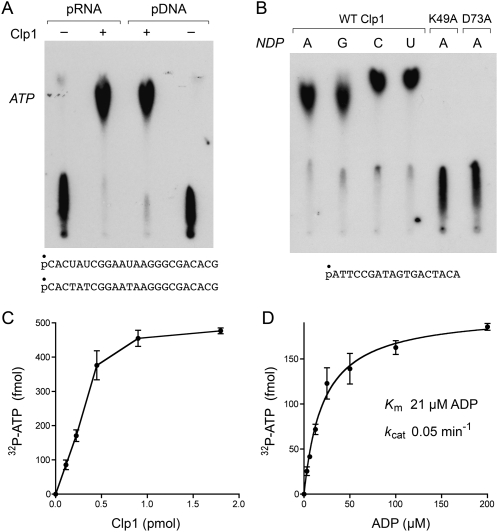
FIGURE 9.
Reversal of the polynucleotide kinase reaction. (A) Reaction mixtures (10 μL) containing 50 mM Tris-acetate (pH 5.0), 10 mM MgCl2, 1 mM ADP, 500 fmol of 5′ 32P-labeled 24-mer DNA or RNA phosphoryl donor (depicted at the bottom), and 1.8 pmol PhoClp1 (where indicated by +) were incubated for 15 min at 55°C. The products were analyzed by PEI cellulose TLC in 2.5 M LiCl. An autoradiograph of the TLC plate is shown. The position of the unlabeled ATP standard is indicated on the left. (B) Reaction mixtures (10 μL) containing 50 mM Tris-acetate (pH 5.0), 10 mM MgCl2, 500 fmol 5′ 32P-labeled 18-mer DNA phosphoryl donor (depicted at the bottom), 1 mM ADP, GDP, CDP, or UDP phosphoryl acceptor, and 1.8 pmol of wild-type of mutant PhoClp1 were incubated for 15 min at 55°C. The products were analyzed by PEI cellulose TLC in 2.5 M LiCl. An autoradiograph of the TLC plate is shown. (C) Reaction mixtures (10 μL) containing 50 mM Tris-acetate (pH 5.0), 10 mM MgCl2, 1 mM ADP, and 500 fmol 5′ 32P-labeled 18-mer DNA, and PhoClp1 as specified were incubated for 15 min at 55°C. The extent of 32P-ATP formation is plotted as a function of input PhoClp1. Each datum is the average of three separate titration experiments. Error bars denote the standard deviation. (D) Reaction mixtures (10 μL) containing 50 mM Tris-acetate (pH 5.0), 10 mM MgCl2, 500 fmol 5′ 32P-labeled 18-mer DNA, 0.3 pmol PhoClp1, and ADP as specified were incubated for 13 min at 55°C. The extent of 32P-ATP formation is plotted as a function of ADP concentration. Each datum is the average of three separate titration experiments. Error bars denote the standard deviation. K m and k cat were calculated in Prism by nonlinear regression curve fitting of the experimental data.

