FIGURE 3.
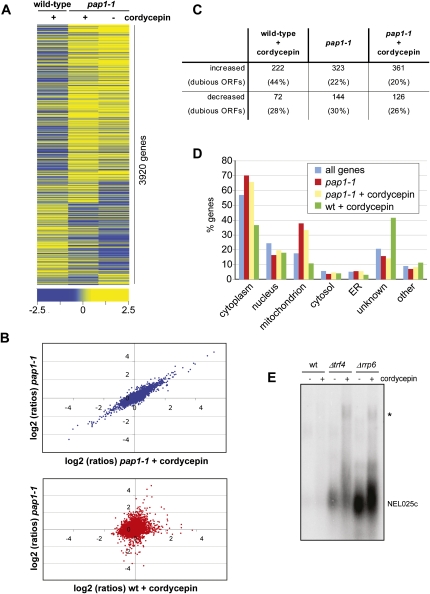
The pap1-1 mutation neutralizes the effects of cordycepin. Gene expression profiling was done with wild-type and pap1-1 strains following a shift for 1 h to medium lacking or containing 20 μg/mL cordycepin, respectively. All experiments were performed in triplicate. (A) Heat map of gene expression changes of cordycepin treated wild-type and nontreated and treated pap1-1 mutant strains relative to the untreated wild-type control. Rows represent genes, and columns represent average values obtained from three independent measurements for the indicated condition; only those 3920 features were represented that gave three values each for all three conditions. Clustering was done with Spearman Row correlation (substance and row) using Acuity 4.0. The color code indicates the distribution of log2 ratios. (B) Scatterplot of gene expression changes (log2 ratios). (Upper graph) Plots signals obtained with the pap1-1 strain in the absence (y-axis) and the presence (x-axis) of cordycepin. (Lower graph) Signals obtained with the pap1-1 strain in the absence of cordycepin (y-axis) are plotted against signals obtained with cordycepin-treated wild-type (x-axis). (C) The table displays the numbers of RNA transcripts that changed at least twofold (log2 value ±1) relative to untreated wild type in the respective conditions. The numbers of transcripts that were derived from dubious open reading frames are indicated in percent in brackets. (D) Transcripts that were increased under the indicated conditions were subjected to Gene Ontology analysis using the SGD slim mapper (http://www.yeastgenome.org/). The number of genes in the individual compartments is presented in percent of all analyzed genes. Also indicated is the background distribution of all genes. (E) Northern blot analysis of total RNA obtained from wild-type and mutant strains following growth in the absence and presence of 20 μg/mL cordycepin. The CUT NEL025c was detected using a random primed labeled probe. (Asterisk) Indicates a transcript that accumulates due to Pap1 dependent 3′ end formation at a downstream gene (Wyers et al. 2005).

