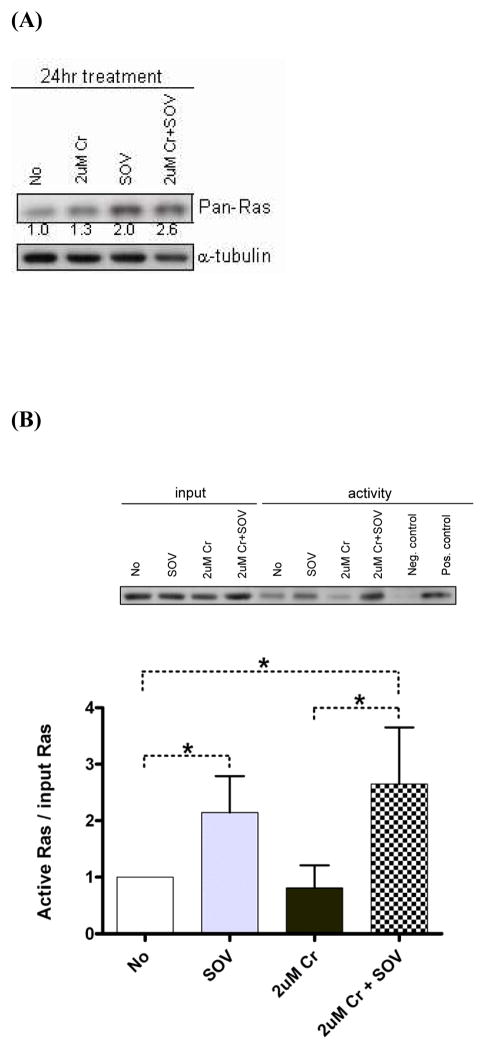
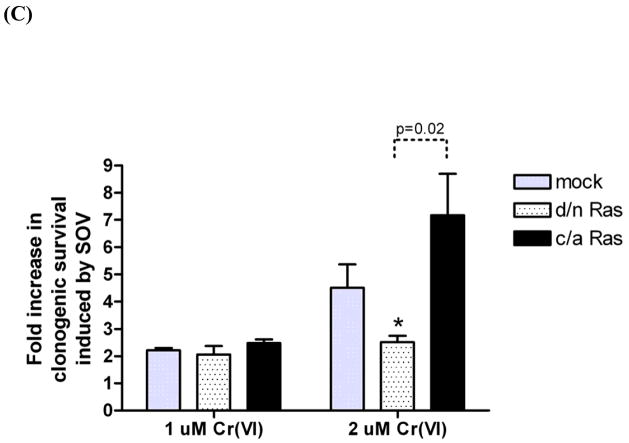
Fig. 6. Ras activity is also responsible for the PTP inhibitor-induced increase in clonogenic survival.
(A)HLFs at 24 hr post-seeding were treated with 2 μM Cr(VI) or 10 μM SOV alone or in combination for 24 hr, and pan-Ras protein expression was analyzed by immunoblotting. Numbers under the blot show pan-Ras protein expression normalized by α-tubulin level. (B) Level ofactive Ras in HLFs treated with 10 μM SOV or 2 μM Cr(VI) alone or in combination for 1 hr was measured by pull down of Ras-GTP bound to the Ras-binding domain of c-Raf followed by immunoblotting with pan-Ras antibody (shown as a insert). Negative and positive control was prepared with GDP and GTPγS, respectively. A bar plot shows the relative level of active Ras expressed as level of active Ras normalized by the Ras input from 3 experiments.*: statistically significant difference among compared groups indicated by dotted line at p<0.05. (C) HLFs at 24 hr post-transfection with 2 μg of indicated plasmid were assayed for clonogenicity as described in Fig. 2. Data are expressed as fold increase in clonogenic survival induced by SOV following 1 μM or 2 μM Cr(VI) treatment. Data are the average ± SE of 3 experiments performed in triplicate. *: statistically significant difference from mock control at p<0.05. Statistical significance is shown with p-value for compared groups indicated by dotted line.


