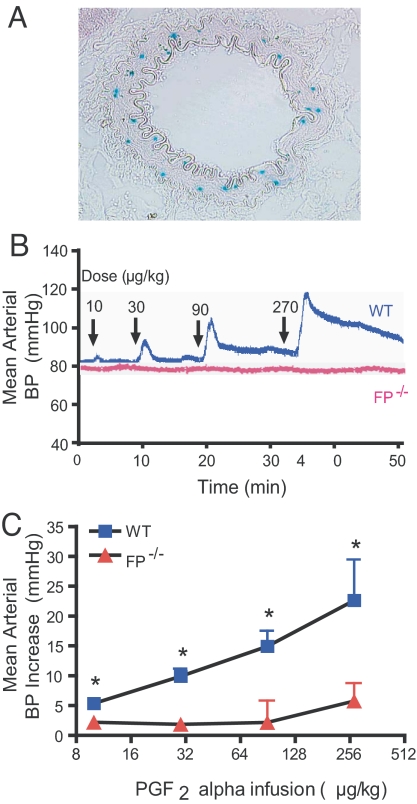
Fig. 4.
Systemic pressor response induced by PGF2α infusion is disrupted in FP−/− mice. (A) FP expression detected in the medial layer of renal resistant artery in FP+/− by β-gal activity (blue). (B) Representative BP tracing from FP−/− and WT litter mates at different doses of PGF2α infusion (arrows). (C) The BP increase after PGF2α administration in FP−/− and WT mice. The BP increase is the difference between peak/trough after injection and baseline. Value are presented as mean ± SEM. *, P < 0.05 (n = 7).

