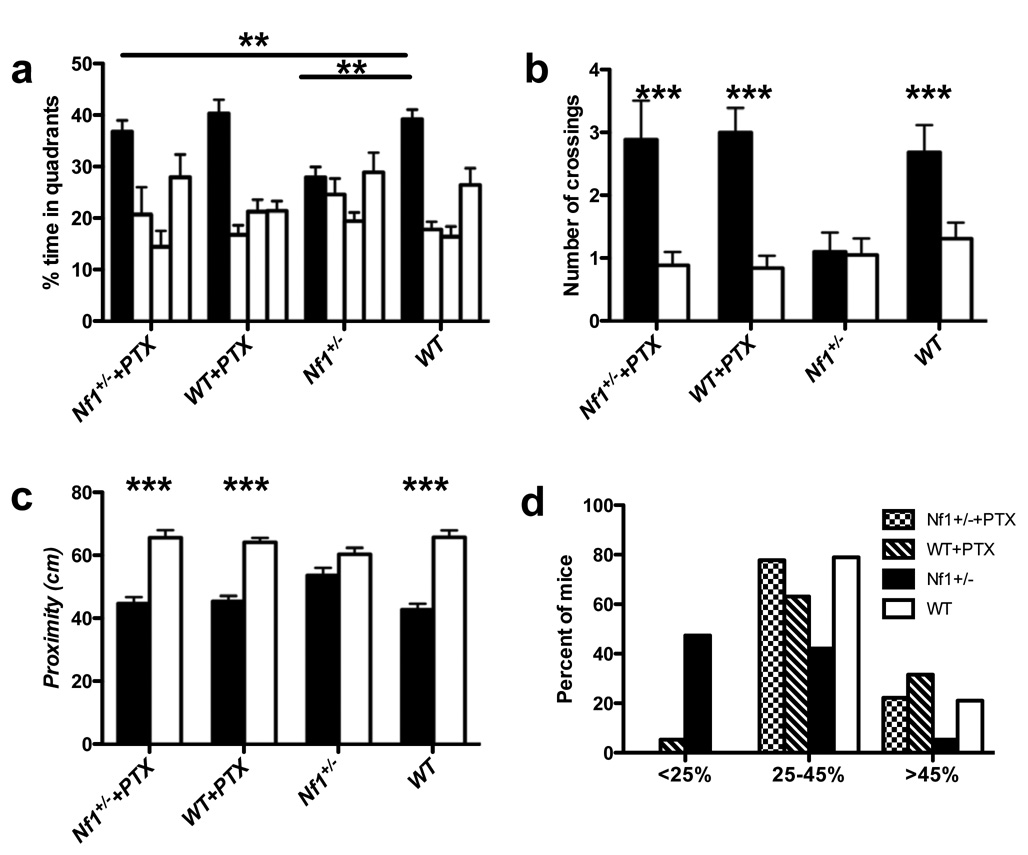
Figure 6. Spatial learning and memory deficits of Nf1+/− mice are reversed by a sub-threshold dose of picrotoxin.
A. Mean percent of time spent in each quadrant during a probe trial. Analysis of the day 7 probe trial showed an interaction between genotype and treatment (F(3,71) = 7.937, P<0.01, two-way ANOVA). 0.01mg/Kg picrotoxin did not affect the searching time of WT mice in the target quadrant (39.23±2.20% for WT treated with saline vs. 40.40±2.64% for WT treated with picrotoxin). Nf1+/− mice treated with picrotoxin searched significantly longer in the training quadrant than Nf1+/− mice treated with saline (27.94±2.05% for Nf1+/− treated with saline vs. 36.83±2.19% for Nf1+/− treated with picrotoxin), and were indistinguishable from WT mice with or without treatment. The figure shows % search times for each of the four quadrants: target (in black), adjacent left, opposite, and adjacent right quadrants (in that order). B. Number of times the mice crossed the exact position where the platform was during the training (solid bar), compared with the number of crossings in the opposite position in the pool (open bar). 0.01mg/Kg picrotoxin did not affect the proximity of WT mice to the target quadrant (2.68±043 times for WT treated with saline vs. 3.00α0.39 for WT treated with picrotoxin). Nf1+/− mice treated with picrotoxin crossed the platform site more times than Nf1+/− mice treated with saline (1.11±0.30 for Nf1+/− treated with saline vs. 2.89±0.63 for Nf1+/− treated with picrotoxin), and were indistinguishable from WT mice with or without treatment. C. Average proximity to the exact position where the platform was during training (solid bar), compared with proximity to the opposite position in the pool (open bar). 0.01mg/Kg picrotoxin did not affect the proximity of WT mice in the target quadrant (42.82±1.84 cm in target quadrant for WT treated with saline vs. 45.44±1.75 cm in target quadrant for WT treated with picrotoxin). Nf1+/− mice treated with picrotoxin searched significantly closer to the platform than Nf1+/− mice treated with saline (53.69±2.32 cm for Nf1+/− treated with saline vs. 44.67±2.15 cm for Nf1+/− treated with picrotoxin), and were indistinguishable from WT mice with or without treatment. D. Distribution of performance of each group of mice in the probe trial. The percentage of mice spending less than 25%, between 25–45% and more than 45% of the time in the training quadrant, during the day 7 probe trial, is plotted for each group. (WT, n=19; Nf1+/−, n=19; WT+PTX, n=19; Nf1+/− +PTX, n=18.)

