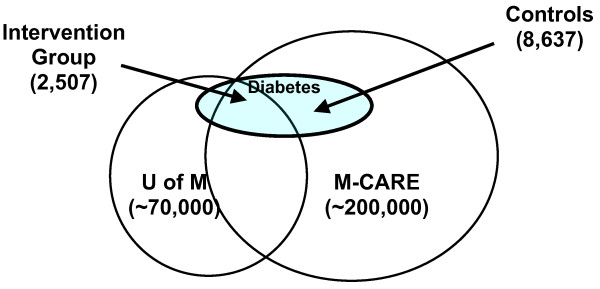
Figure 1.
Identification of intervention and control groups. The large circle on the left (labeled 'U of M') depicts University of Michigan employees and dependants. The large circle on the right (labeled M-CARE) depicts M-CARE enrollees, with the central area of overlap representing UM employees enrolled in M-CARE. The subset of individuals with diabetes is depicted by the shaded circle labeled 'Diabetes.' The intervention group includes UM employees and dependents with at least one pharmacy claim for a glycemic medication (oral, injectable, or inhaled) within the 12 months prior to the study timeframe. The control group consists of M-CARE enrollees who are employees and dependents of other, non-UM employers with at least one pharmacy claim for a glycemic medication within the 12 months prior to the study timeframe.

