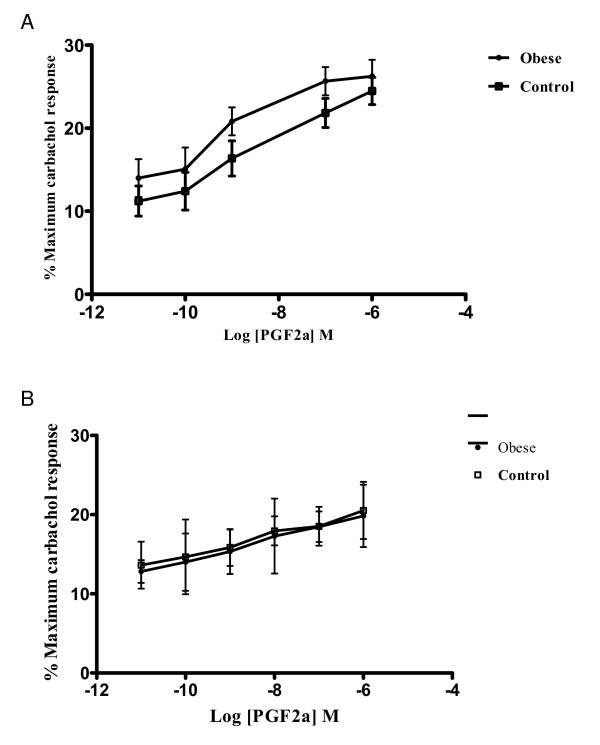
Figure 2.
A. Logarithm concentration-response curves of prostaglandin F2a as measured from strips from obese and control patients. Results are the mean (SD) of 6–8 preparations from different patients, with the response expressed as a percentage of the maximal effect of atropine (1 umol/L). The differences demonstrated are statistically significant. B. Logarithm concentration-response curves of prostaglandin F2a as measured from strips from obese and control patients under NANC conditions. Results are the mean (SD) of 6–8 preparations from different patients, with the response expressed as a percentage of the maximal effect of atropine (1 umol/L). There is no statistically significant difference between the groups.

