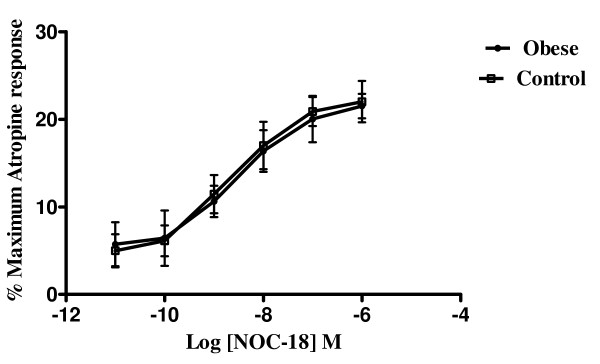
Figure 4.
Logarithm concentration-response curves of a nitric oxide donor (deta-nonoate) from obese and control patients. Results shown are a mean of 6–8 patients in each group, expressed as a percentage of the maximum response to atropine (I micromol/L). A virtually identical graph was obtained when the experiment was performed under NANC conditions. There are no statistically significant differences demonstrated in either group.

