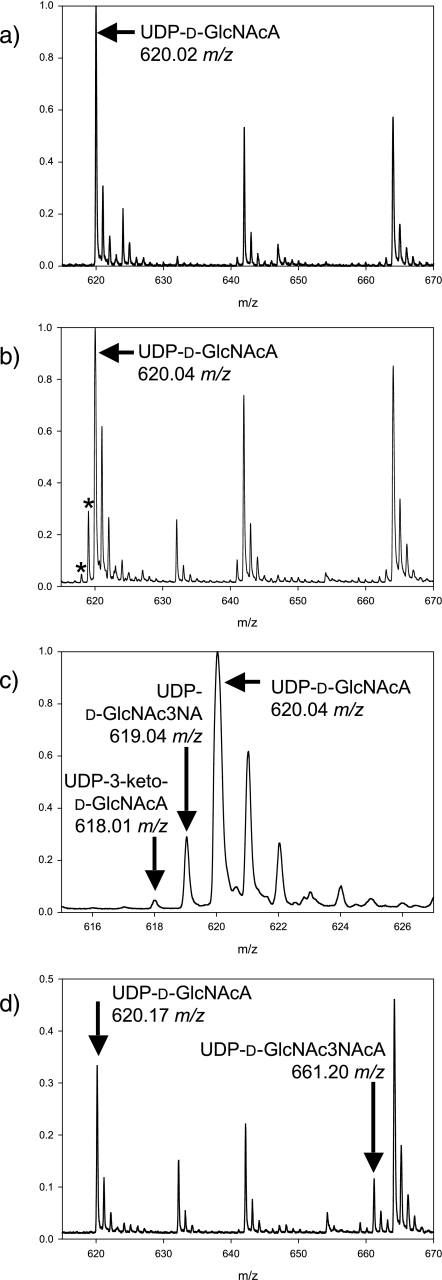
FIGURE 4.
Mass spectra of reactions incubated with WbpB, WbpE, and WbpD. a, the substrate, UDP-d-GlcNAcA (621.34 g/mol), yields a mass spectrum in negative ion mode with observed peaks at 620.02 m/z and its natural abundant isotopes at ∼621, ∼622, and ∼623 m/z. b, after incubation with both WbpB and WbpE, two additional peaks appear at 618.01 and 619.04 m/z (marked by an asterisk), corresponding to UDP-3-keto-d-GlcNAcA (619.33 g/mol) and UDP-d-GlcNAc3NA (620.36 g/mol), respectively. Neither peak was observed when either WbpB or WbpE was reacted alone (data not shown). c, enlarged view of panel b, showing the peaks that correspond to UDP-3-keto-d-GlcNAcA and UDP-d-GlcNAc3NA. d, after incubation with WbpB, WbpE, and WbpD, a new peak not present in the no-enzyme control appears at 661.20 m/z corresponding to UDP-d-GlcNAc3NAcA (662.40 g/mol). The 661 m/z peak was not observed when WbpD was absent from the reaction mixture (data not shown).

