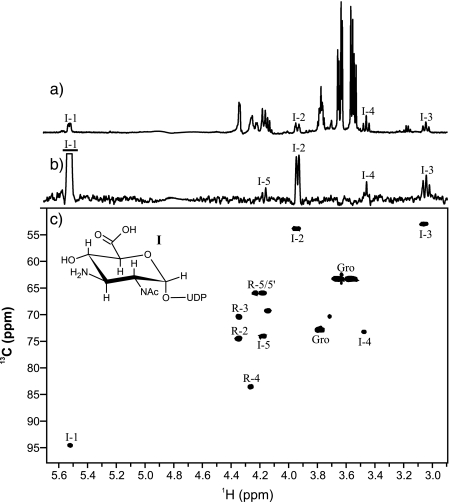
FIGURE 5.
NMR spectroscopy of the purified WbpB/WbpE reaction product UDP-α-d-GlcNAc3NA (I). a, proton spectrum (128 scans). b, one-dimensional TOCSY (80 ms) of I H1. c, 1H-13C HSQC spectrum (128 scans, 128 increments, 1JC,H = 140 Hz, 20 h). For selective one-dimensional experiments, excited resonances are underlined. R is ribose and Gro is glycerol.

