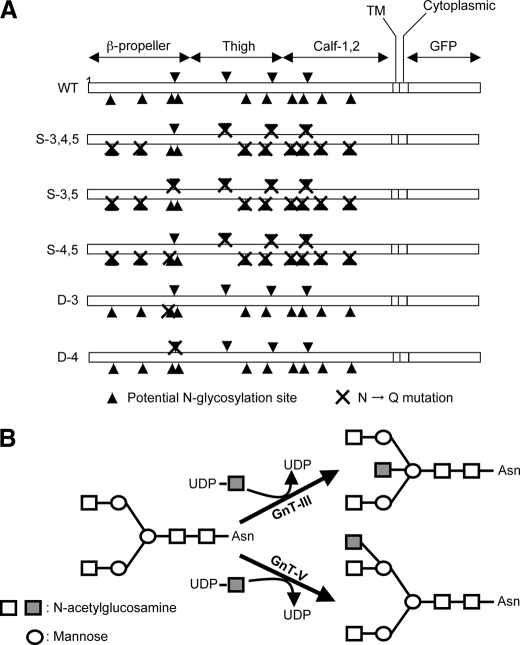
FIGURE 1.
Potential N-glycosylation sites on the α5 subunit and its modification by GnT-III and GnT-V. A, schematic diagram of potential N-glycosylation sites on the α5 subunit. Putative N-glycosylation sites are indicated by triangles, and point mutations are indicated by crosses (N84Q, N182Q, N297Q, N307Q, N316Q, N524Q, N530Q, N593Q, N609Q, N675Q, N712Q, N724Q, N773Q, and N868Q). B, illustration of the reaction catalyzed by GnT-III and GnT-V. Square, GlcNAc; circle, mannose. TM, transmembrane domain.

