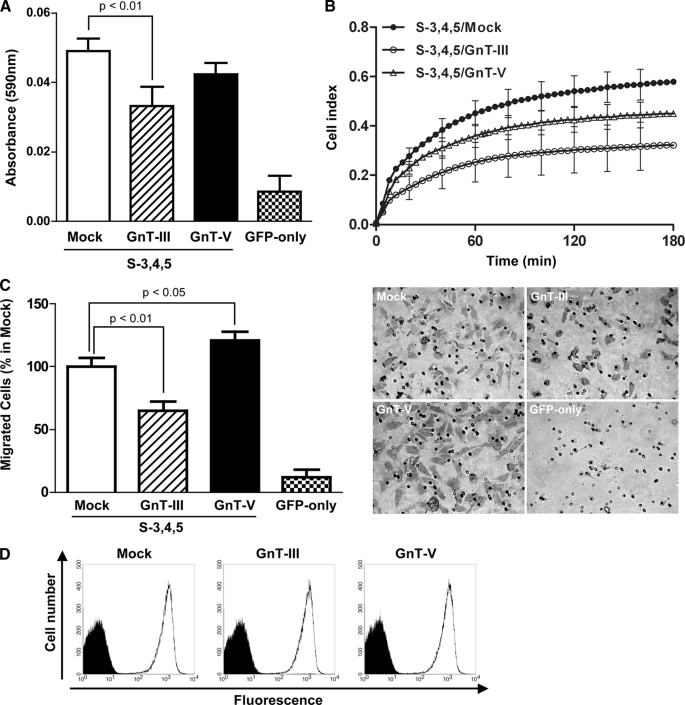
FIGURE 3.
Effects of overexpression of GnT-III and GnT-V on FN-mediated cell adhesion and migration in S-3,4,5 mutants. A, subconfluent cells were detached, and 40,000 cells were added to the 96-well plates coated with 3 μg/ml FN for the cell adhesion assay. The plates were incubated at 37 °C for 20 min and then washed twice with warmed phosphate-buffered saline to remove non-adherent cells. The adherent cells were fixed with 25% glutaraldehyde and stained with 0.5% crystal violet, and then the absorbance at 590 nm was measured. The bars represent the S.D. B, cell adhesion kinetics assay using the RT-CES system. Subconfluent cells were detached, and 10,000 cells were applied to wells of an electrosensing plate coated with 10 μg/ml FN. The device was operated with RT-CES SP software. The cell index represents the extent of cell adhesion. The bars represent the S.D. C, cell migration toward FN was determined using the Transwell assay as described under “Experimental Procedures.” Cells that migrated were stained with 0.5% crystal violet and counted under a microscope. The bars represent the S.D. A representative example is shown in the right panel. D, subconfluent cells were detached and labeled with primary antibody (mouse anti-human VLA5 antibody, HA5) for 30 min on ice. The labeled cells were washed with ice-cold phosphate-buffered saline and then incubated with Alexa Fluor 647 goat anti-mouse IgG for 30 min on ice. The expression levels of α5 integrin on the cell surface were measured using a FACSCalibur instrument (BD Biosciences). Negative controls were not treated with the primary antibody but underwent all other procedures.

