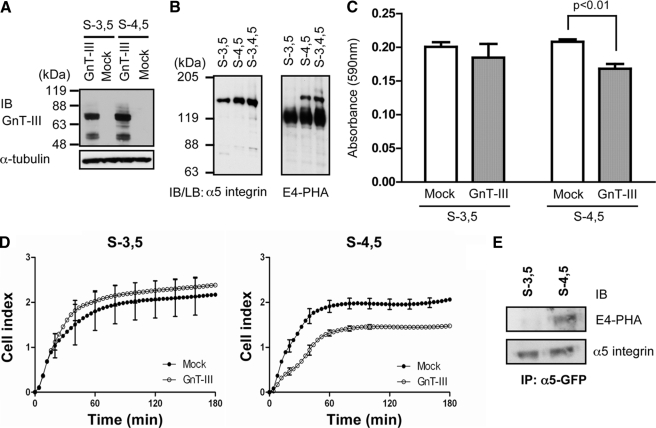
FIGURE 4.
Comparison of effects of GnT-III on N-glycosylation and cell adhesion between S-3,5 and S-4,5 mutants. A, GnT-III was expressed in S-3,5 and S-4,5 mutants, and stable expression cells were established as described under “Experimental Procedures.” The expression levels of GnT-III were detected with an antibody against GnT-III. B, confluent cells were lysed and then subjected to immunoprecipitation (IP) using an agarose-conjugated antibody against GFP. The immunoprecipitates were subjected to 6.0% SDS-PAGE under non-reducing conditions, blotted, probed with E4-PHA (right panel), and then reprobed with antibody against the α5 subunit (left panel). C, the cell adhesion assay was carried out as described above (Fig. 3A). The bars represent the S.D. D, the cell adhesion kinetics assay using the RT-CES system was the same as that described in Fig. 3B. Subconfluent cells were detached, and 40,000 cells were added to the wells. The cell index reflects the extent of cell adhesion. The bars represent the S.D. E, the S-3,5 and S-4,5 expression vectors were transfected into HeLa cells using the Phoenix retrovirus system and selected with puromycin as described under “Experimental Procedures.” The cells were lysed, and the cell lysates (2 mg) were then subjected to immunoprecipitation using an agarose-conjugated antibody against GFP. The immunoprecipitates were subjected to 6.0% SDS-PAGE under non-reducing conditions, blotted, probed with E4-PHA (upper panel), and then reprobed with antibody against the α5 subunit (lower panel). IB, immunoblot; LB, lectin blot.

