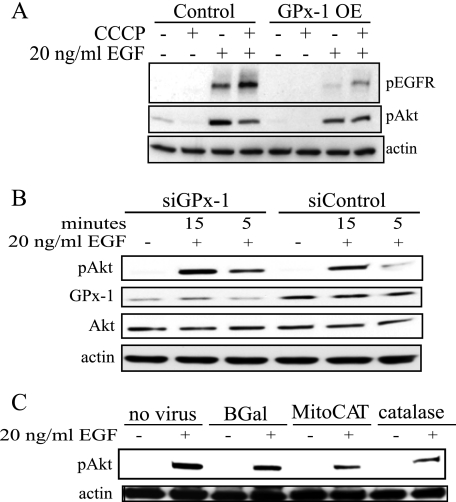
FIGURE 4.
EGFR stimulation and expression in GPx-1-overexpressing cells. A, cells were serum-starved for 1 h followed by treatments with 20 ng/ml EGF. The extracts were separated on reducing SDS-PAGE gradient gels (4–15%), transferred to Hybond membranes, and probed with the indicated antibodies. A, control or GPx-1 OE were treated with EGF for 10 min in the presence or absence of CCCP, a mitochondrial uncoupler. B, cells were treated with siGPx-1 or control siRNA for 48 h followed by stimulation with EGF for 15 and 5 min. C, cells were pretreated with β-galactosidase (BGal), MitoCAT, or catalase containing adenoviruses for 48 h followed by 10 min EGF.

