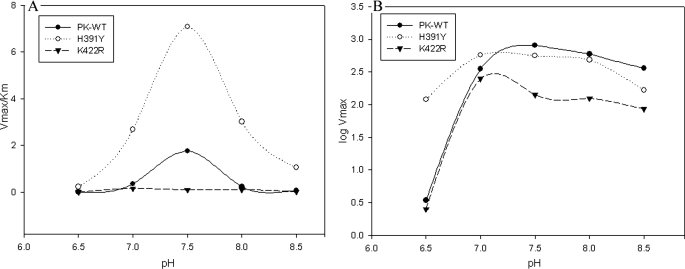
FIGURE 3.
A, PK-WT and the mutant enzymes were incubated at different pH values in 50 mm Tris-Cl buffer and assayed under standard conditions as described under “Experimental Procedures.” A graph of log Vmax and pH was plotted to check the pH optimum of the P-enolpyruvate-bound state of the enzymes. B, P-enolpyruvate titration study was done at different pH values in Tris-Cl buffer, and Km values at each individual pH were calculated. The Vmax/Km ratios obtained at different pH values were plotted against pH as shown.

