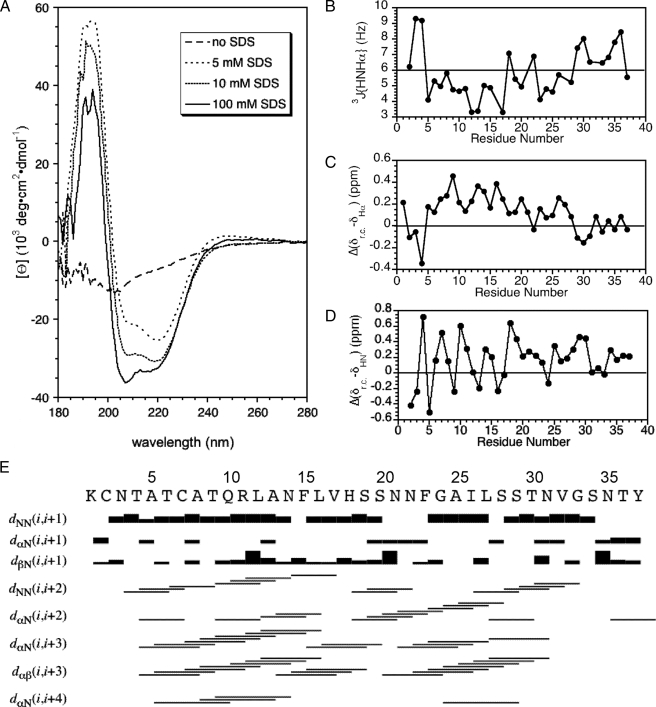
FIGURE 2.
Data illustrating the α-helix structure of micelle-bound amylin. A, CD spectra of amylin at 0, 5, 10, and 100 mm concentrations of SDS. B, 3JHNHα couplings obtained from a three-dimensional HNHA experiment. C, secondary Hα chemical shifts calculated as the difference between micelle-bound amylin and “random coil” values (38). D, periodicity of HN chemical shifts illustrated as the difference from random coil values (38). E, summary of short-range NOEs.

