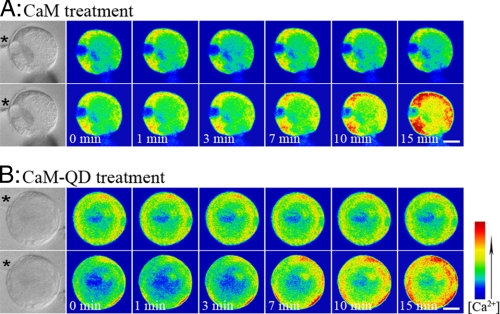
FIGURE 5.
Time course of CaM/QD-CaM probe-induced changes in intracellular Ca2+ levels in lily pollen protoplasts. A, upper panels, pseudocolor images of the resting intracellular Ca2+ concentration in a lily protoplast loaded with calcium green-dextran (control). Lower panels, affect on the intracellular Ca2+ level upon adding 1 μm CaM to the bathing solution. B, upper panels, pseudocolor images of the resting intracellular Ca2+ concentration in a lily protoplast loaded with calcium green-dextran (control). Lower panels, affect on the intracellular Ca2+ level upon adding 1 μm QD-CaM to the bathing solution. Scale bars, 2.5 μm. The bar on the right shows the relationship between Ca2+ concentration and cell pseudocolor. The asterisks indicate the locations of micropipettes used to introduce calcium green-dextran.

