FIGURE 3.
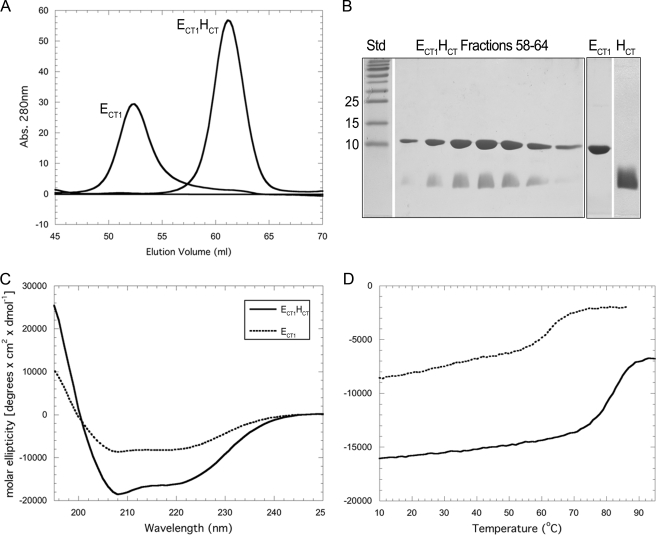
Purification and characterization of ECT1 and ECT1HCT. A, overlay of ECT1 and ECT1HCT elution profiles collected during passage of the samples over a16 × 500 mm Superdex 75 gel filtration column. Binding of HCT to ECT1 resulted in an elution volume shift from 52 to 60.5 ml. This corresponds to a change in estimated molecular mass (spherical protein) from 35 to 22 kDa, compared with actual molecular masses of 12. kDa and 15 kDa for ECT1 and ECT1HCT, respectively. The change in elution volume suggests that HCT binding effectively reduced the spherical volume of ECT1, likely by out-competing homodimer formation. B, 15% SDS-PAGE gel of the ECT1HCT elution peak and individually purified components visualized by Coomassie staining. ECT1 and HCT were produced individually as fusion proteins and reconstituted as described under “Experimental Procedures.” C, CD wavelength scan of ECT1 and ECT1HCT in 10 mm sodium phosphate (pH 7) at 25 °C. Although retaining a shape indicative of mixed secondary structure, ECT1HCT exhibits a greater molar ellipticity than ECT1. Although this may be partially explained by the additional α-helical content contributed by HCT, it is also likely that HCT stabilizes ECT1 fold. This is further supported by the increase in thermal stability observed for ECT1HCT versus ECT1 alone (D) and additionally studied in Fig. 4.

