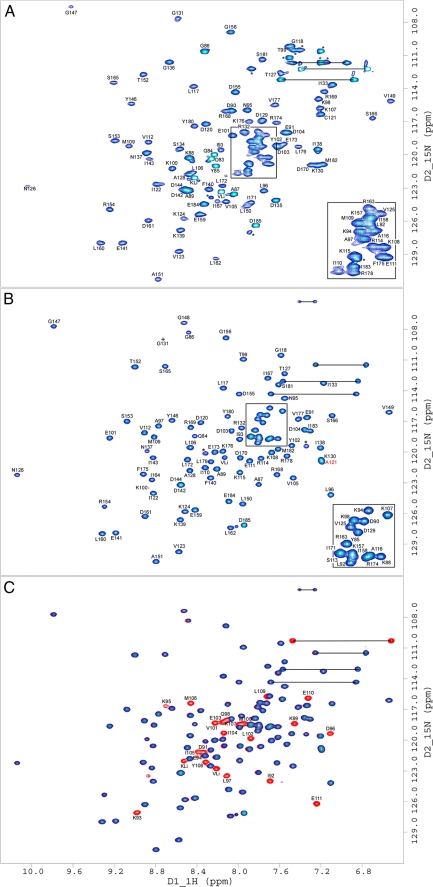
FIGURE 4.
15N HSQC NMR spectra of ECT1 and ECT1HCT. Two-dimensional 1H/15N HSQC NMR spectra taken at 298 K in 25 mm sodium phosphate (pH 7), 0.5 mm EDTA, and 0.02% NaN3. Spectra presented are: ECT1 (A), ECT1HCT where HCT is unlabeled for clarity (B), and where ECT1HCT is fully labeled (red) and is overlaid by the partially labeled spectrum from B in blue (C). The observed change in ECT1 behavior upon HCT binding, explored in Fig. 3, is further evidenced here by the global improvement in backbone amide peak signal dispersion and homogeneity indicative of ECT1 fold stabilization by HCT binding. Side chain amide peaks are linked by black horizontal lines. Resonances marked with an asterisk belong to amino acid side chains (e.g. Arg) or residues that could not be assigned because of overlap/poor signal to noise. KLi and VLi are part of the N-terminal linker (GPKVP). For ECT1 and ECT1HCT, Ser113, Gly148, Ile164, Ser134, Asp135, and Gly136 could not be assigned, respectively. The mutation Ta_E C121A has been described previously (Ref. 12; indicated by the red label in B). The concentration of NMR samples was between 0.5 and 1 mm.

