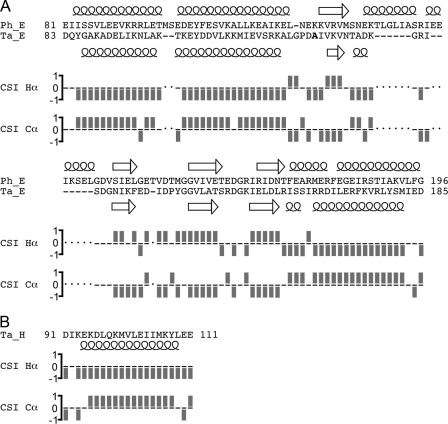
FIGURE 5.
Secondary structure analysis of ECT1HCT as carried out by the chemical shift index protocol. A, the sequence alignment of the T. acidophilum ECT1 (Ta_ECT1) and the P. horikoshii ECT (Ph_ECT) was performed manually and refined by secondary structure comparison. Note that Ph_ECT has two α-helices connecting β-strands 1 and 2 that are significantly shorter in Ta_ECT1. The secondary structure for Ph_ECT (from the crystal structure; Ref. 11) and Ta_ECT1 (from the Hα and Cα chemical shift values using the chemical shift index (CSI) protocol as described under “Experimental Procedures”). The overall high degree of secondary structure similarity between the two proteins suggests that Ph_ECT is a good model for Ta_ECT1. Furthermore, the retention of secondary structure in Ta_ECT1 when bound to HCT, as shown here, indicates that the break up of Ta_ECT1 dimers by the addition of HCT (Figs. 3 and 4) is accompanied by a rearrangement of secondary structure elements rather than a change in composition of the same. B, the secondary structure analysis of HCT indicates α-helix for residues ∼95–108. See supplemental Fig. S4 for absolute deviations of 1Hα and 13Cα chemical shift values from random coil values.

