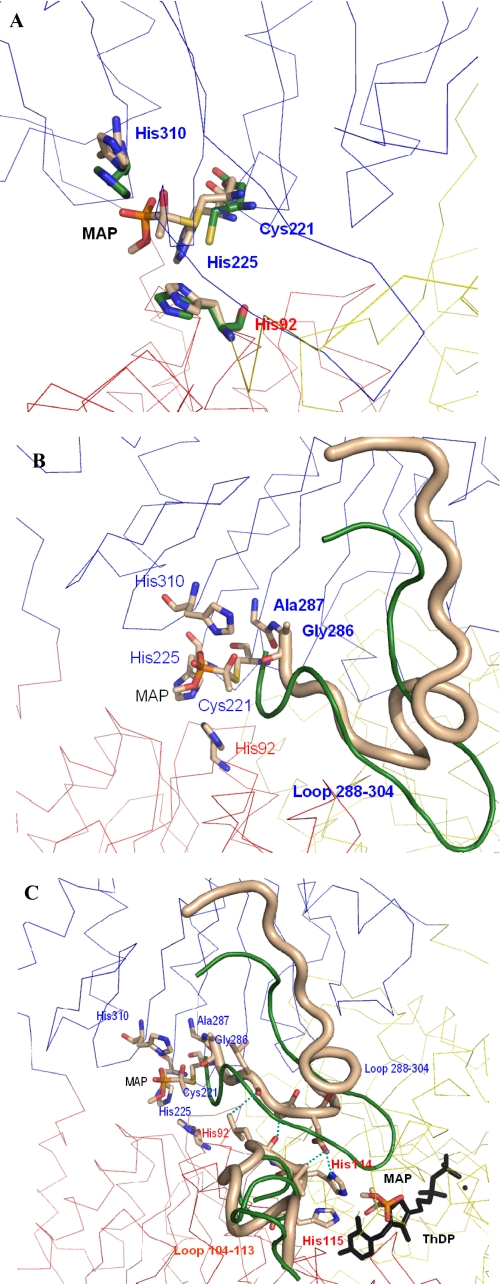
FIGURE 6.
Snapshots of the signal transduction pathway from the regulatory to the active site in yeast PDCs. The different subunits are shown as Cα trace in different colors, the labeled residues are shown as sticks, and the color of the label is that of the subunit the residue belongs to. A, overlay of one regulatory site before (carbon atoms in green) and after covalent binding of the activator MAP at Cys-221 (carbon atoms in beige). The 4 Å shift of the thiohemiketal is clearly to be seen. B, the shift of the thiohemiketal causes direct interactions to residues Ala-286 and Gly-287 and restructures the whole loop region 288–304 (beige tube; loop conformation before activation is shown in green). C, the structured loop 288–304 induces direct interactions to the other loop region 104–113, and the H-bonds between both loops are illustrated as blue dashed lines. The new conformation of this loop (beige, loop conformation before activation in green) reorients the adjacent residues His-114 and His-115, which now can directly interact with the activator molecule bound at the C2 atom of ThDP.

