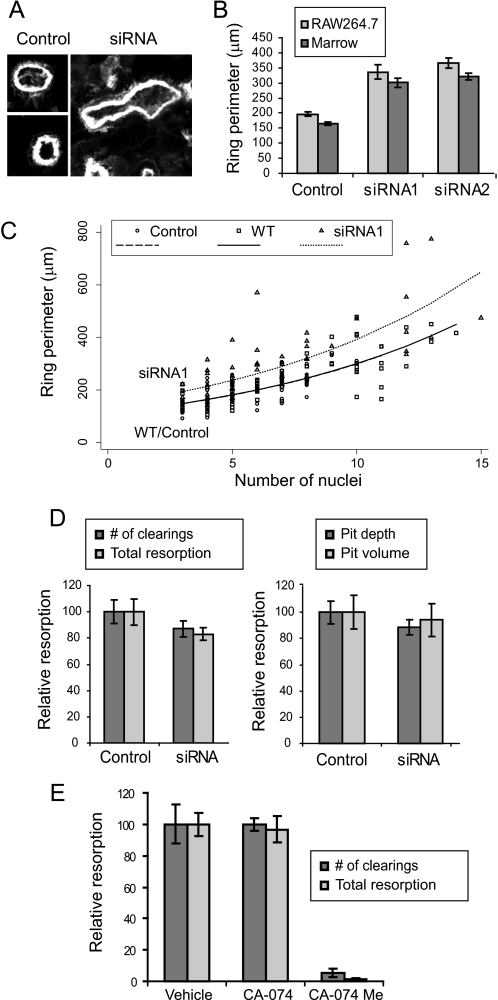
FIGURE 6.
Effects of myosin IIA and cathepsin B on sealing zone formation and resorption. A, examples of sealing zones from control- or siRNA-treated cells on ivory are shown. Cells were labeled with fluorescent phalloidin and photographed at the same scale. B, RAW264.7- or marrow-derived osteoclasts were treated with control oligonucleotides, siRNA1, or siRNA2. The sealing zone perimeters of siRNA-treated marrow cells were statistically different from controls, as were the perimeters of siRNA-treated RAW264.7 cells (all p values < 0.000001). C, nuclear number versus actin ring perimeter was plotted for wild type (WT) RAW264.7 osteoclasts as well as for control- or siRNA-transfected cells. As in the cell perimeter data above, the slopes of the log-transformed data were not significantly different (p = 0.925), leading to the use of a common slope model. Comparison of wild type and control cells showed no significant difference, whereas the actin rings of siRNA1 cells were significantly different from controls at 10 nuclei and at the intercept (p < 0.001). D, control- or siRNA1-treated osteoclasts were assayed for resorptive capacity on synthetic bone substrate (left) or ivory slices (right); no significant differences were noted between controls and siRNA treatment. E, treatment of osteoclasts (days 3–6 of culture) with CA-074Me, but not CA-074, dramatically reduced bone resorptive capacity. For both number of clearings and total resorption, p < 0.00005.

